The Math Behind Breathing Room
Every vault depositor asks the same question: “What's my expected loss?” Most RWA protocols hand-wave. We built a 3-axis actuarial model — verification, escrow, and recovery right — that produces 24 combinations. 23 of them are viable for depositors. Here's the math.
When you're asking DeFi depositors to put capital into a vault backed by real estate collateral, you can't show up with vibes. You need math. So we built an actuarial loss model, calibrated it from public data — Case-Shiller indices, MBA delinquency surveys, FDIC loss severity records — and stress-tested it against the 2008 Miami crash.
If you can't answer “what's my expected annual loss rate?” with numbers, you don't have a risk model — you have a pitch deck. Here are our numbers.
The Three Axes
Risk in UnblockEquity isn't a single number — it's a product of three independent borrower choices that each affect a different part of the loss equation:
How much does the borrower prove? More verification = lower base PD = lower origination fee.
Months of mortgage payments held in smart contract escrow. Mandatory if delinquent. Reduces effective PD through cure rates.
Does the lender have foreclosure rights, or just a passive lien? Foreclosure dramatically reduces LGD — and unlocks higher LTV.
Three axes. Four escrow options. Two recovery modes. That gives us 3 × 4 × 2 = 24 unique product combinations. Each one maps to a distinct EL = PD × LGD, and therefore a distinct depositor yield.
How Breathing Room Crushes PD
The formula is simple: Effective PD = Base PD × (1 − Cure Rate). During the escrow period, the borrower's mortgage payments are guaranteed from escrowed funds. They're not defaulting — they're performing. MBA data shows that borrowers who receive 12 months of payment relief have a 70% cure rate. Here's what that does to PD across verification levels:
| Combination | Base PD | Cure Rate | Formula | Effective PD |
|---|---|---|---|---|
| Verified + BR12 | 2.5% | 70% | 2.5% × (1 − 0.70) | 0.75% |
| Prime + BR6 | 4.0% | 50% | 4.0% × (1 − 0.50) | 2.00% |
| Standard + BR12 | 17.0% | 70% | 17% × (1 − 0.70) | 5.10% |
| Standard + BR3 | 17.0% | 35% | 17% × (1 − 0.35) | 11.05% |
| Standard + Naked | 17.0% | 0% | 17% × (1 − 0) | 17.00% |
Breathing Room's cure rate is the single most powerful lever in the model. A Standard borrower (17% base PD) with BR12 achieves a lower effective PD (5.10%) than a Prime borrower with no escrow (4.0%). Time heals — people find new jobs, stabilize income, work out repayment plans. The escrow buys that time.
The Foreclosure Paradox: How Higher LTV Can Be Safer
This is the counterintuitive insight that makes the 3-axis model work. A lien-only position at 62.5% LTV means the depositor has no direct enforcement — they wait for the homeowner to sell or refinance. If the homeowner defaults on the primary mortgage and the property goes to a bank-owned (REO) sale, the junior lien holder gets paid last. After 28 months of missed payments, legal fees, force-placed insurance, and the REO discount, LGD is 41.4%.
But if the SEA includes foreclosure rights, the lender can initiate their own recovery process — much faster, much cheaper, and without waiting behind the primary mortgage servicer's timeline. This drops LGD dramatically:
| Recovery Right | LTV | LGD | Impact |
|---|---|---|---|
| Lien-only | 62.5% | 41.4% | Passive lien. Wait for sale/refi. |
| Foreclosure | 62.5% | 20.3% | Active recovery. 51% LGD reduction. |
| Foreclosure | 75.0% | 25.6% | Higher LTV AND still safer than lien-only at 62.5%. |
This means a borrower who grants foreclosure rights can access 75% LTV instead of 62.5% — 20% more capital — while the depositor is actually better protected. It's not a tradeoff. It's a Pareto improvement.
The Full EL Matrix: 24 Combinations
Expected Loss = Effective PD × LGD. At 8% gross APR and 0.5% protocol costs, here's what the depositor earns across all 24 combinations:
| Verification | Naked | BR3 | BR6 | BR12 |
|---|---|---|---|---|
| Verified (2.5%) | 1.04% 6.46% yield | 0.67% 6.83% yield | 0.52% 6.98% yield | 0.31% 7.19% yield |
| Prime (4.0%) | 1.66% 5.84% yield | 1.08% 6.42% yield | 0.83% 6.67% yield | 0.50% 7.00% yield |
| Standard (17%) | 7.04% 0.46% yield | 4.57% 2.93% yield | 3.52% 3.98% yield | 2.11% 5.39% yield |
| Verification | Naked | BR3 | BR6 | BR12 |
|---|---|---|---|---|
| Verified(75% LTV) | 0.64% 6.86% yield | 0.42% 7.08% yield | 0.32% 7.18% yield | 0.19% 7.31% yield |
| Prime(70% LTV) | 0.81% 6.69% yield | 0.53% 6.97% yield | 0.41% 7.09% yield | 0.24% 7.26% yield |
| Standard(70% LTV) | 3.45% 4.05% yield | 2.24% 5.26% yield | 1.73% 5.77% yield | 1.03% 6.47% yield |
23 out of 24 combinations deliver viable depositor yields (above 2.5%). The only non-viable combo is Standard + Naked + Lien-Only: a 17% PD borrower with no escrow protection and no recovery right. Every other combination works because at least one axis provides meaningful risk reduction.
Net yields range from 0.46% (the single non-viable combo) to 7.31% (Verified + BR12 + Foreclosure). For context, Ondo OUSG yields 5.3% on tokenized Treasuries, and Midas mBASIS yields 5.2%. Most of our 24 combos beat both — backed by tangible US residential real estate instead of Treasury rehypothecation.
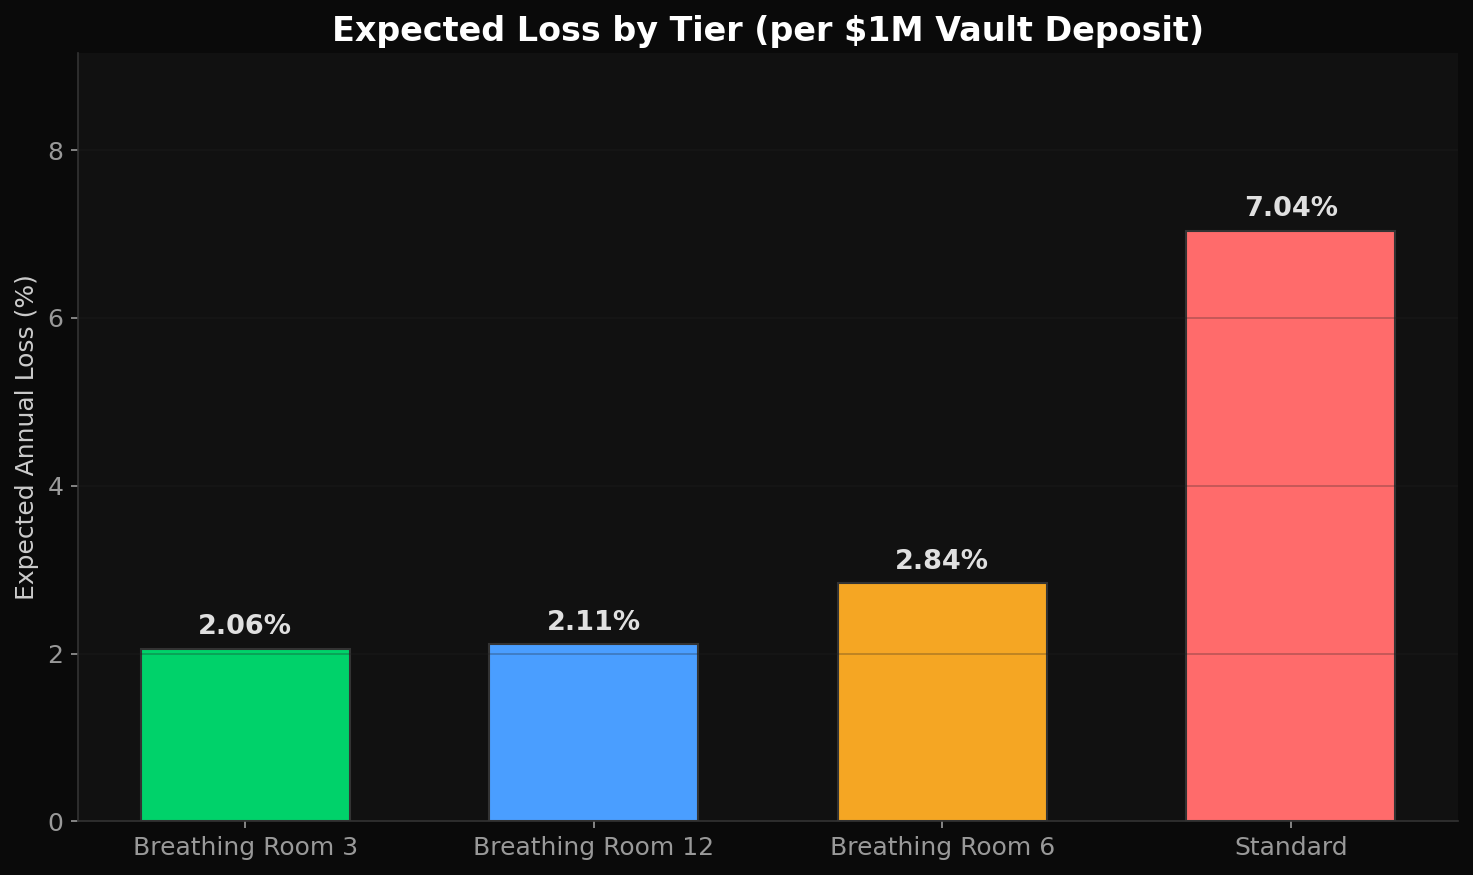
Expected loss distribution across the 3-axis product space
Why So Low?
Three structural advantages compound to keep EL low:
Self-Sustaining Positions
Borrowers choose their own borrow amount with a slider — they are never forced to max out. All equity is tokenized and posted as collateral from day one, but the borrow amount is what the homeowner controls. Less borrowing means a safer position.
The breakeven home price appreciation needed to cover interest is straightforward:
Florida's 10-year average home appreciation runs 3–5% annually. For most realistic borrow amounts, the breakeven is well under 1–2% — meaning the home's natural value growth covers the Morpho interest with room to spare. Positions improve automatically over time with no borrower action required. In normal markets, there is no liquidation risk.
Validated Against Real Data
We backtested against 506K HELOC denial records from the CFPB (2022) across five states, combined with NY Fed Consumer Credit Panel foreclosure rates. The result:
The Cost of Doing Nothing
Take a $500K property. After 28 months of missed payments, late fees, attorney costs, force-placed insurance, and a 25% REO discount, the homeowner's $130K in equity is completely consumed. They get $0. The system destroys $262K in total value. Breathing Room prevents it for $27K.
Stress Tested
We ran 10,000 Monte Carlo price paths calibrated from Case-Shiller Miami data, then overlaid the actual 2008 crash trajectory — a 49.3% peak-to-trough decline, the worst metro-level drop in modern US history.
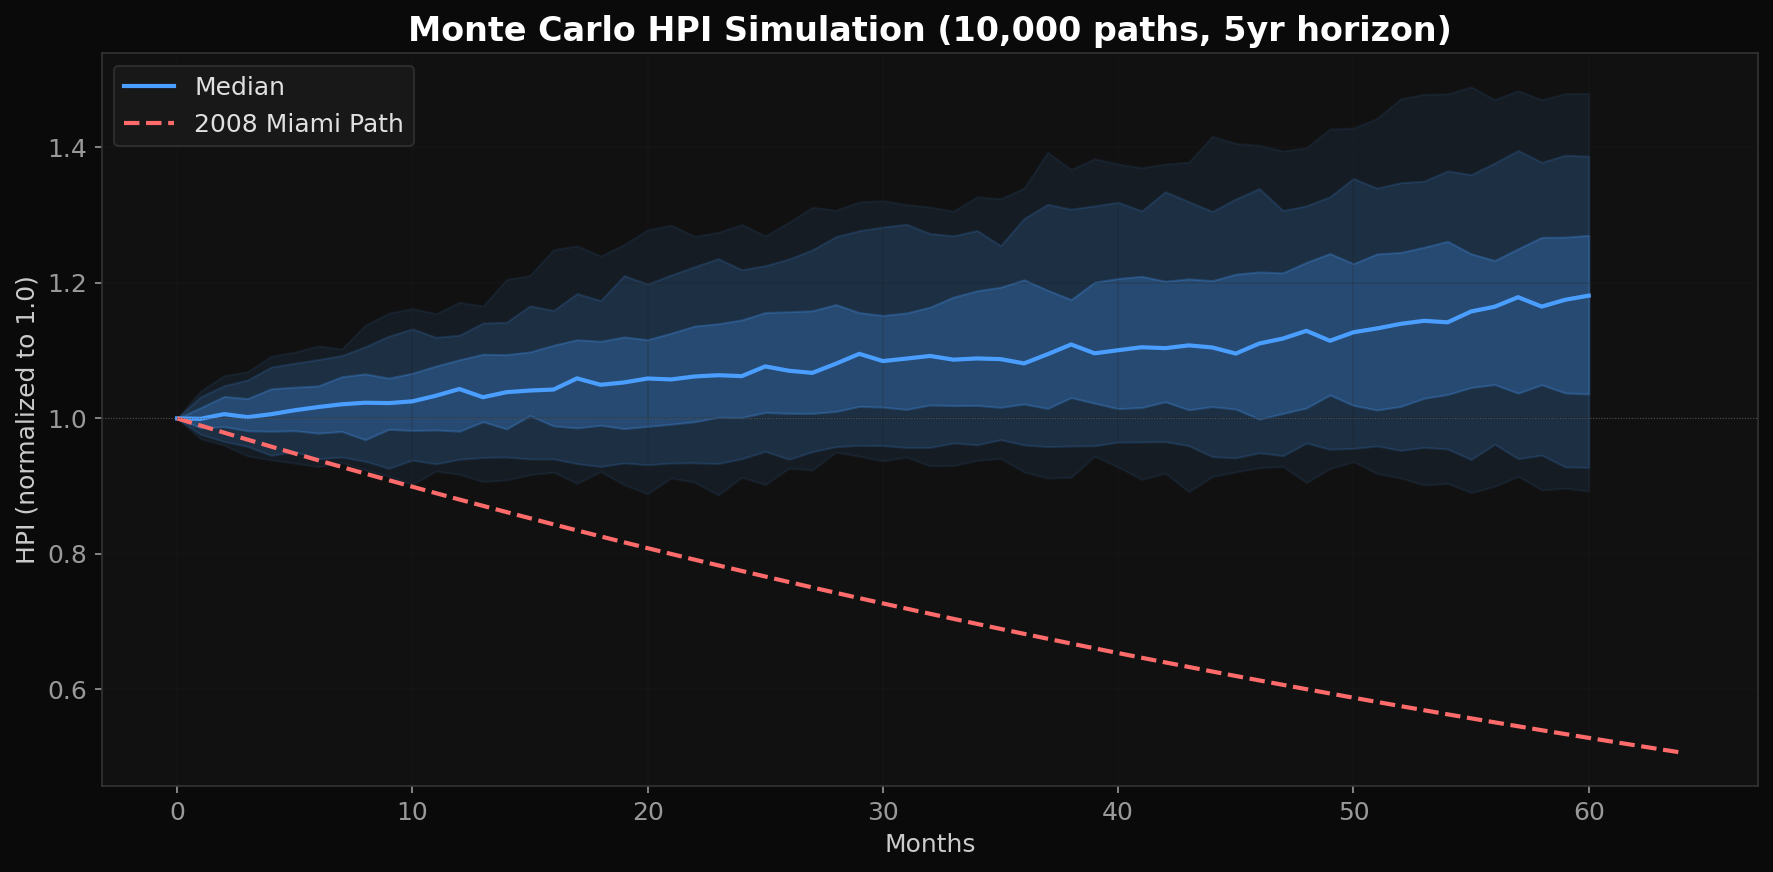
10,000 Monte Carlo price paths with 2008 Miami overlay
Even in a 2008 replay, BR12 depositors earning 8% gross APR would see ~4.75% annual net loss — severe but survivable, and far better than the 60%+ drawdowns common in crypto lending. Real estate doesn't crash overnight: that Miami trough took 5 years to reach, giving vaults time to adjust. With foreclosure rights, the 2008-replay EL drops further — active recovery during a downturn beats waiting for a market that may take years to return. The full stress test breakdown is in the interactive report.
So What Does the Depositor Actually Earn?
At 8% gross APR minus expected loss and 0.5% protocol costs, the full product space delivers net yields from 0.46% (the single non-viable combo) to 7.31% (Verified + BR12 + FC). The majority of combos land in the 5-7% range — comparable to Ondo OUSG (5.3%) and Midas mBASIS (5.2%), but backed by tangible US residential real estate instead of Treasury rehypothecation. And unlike tokenized Treasuries, vault shares are instantly redeemable on Base — no lockups, no redemption queues.
The 3-axis model means curators can build vaults for every risk appetite: a “Credit-Verified” vault accepting only Verified + Prime borrowers (EL under 1.7%), a “Breathing Room” vault focused on BR6/BR12 combos (EL 0.5-2.1%), or a “Recovery Right” vault that requires foreclosure consent for maximum LGD protection. Mix and match. The math works at every layer.
Full 24-combo EL matrix, stress tests, Monte Carlo results, yield comparisons, and methodology.
View reportPD/LGD models, Monte Carlo simulation, stress tests, vault return projections, and complete methodology with appendices.