Risk Analysis:
eqBLOCK Real Estate Collateral on Base
UnblockEquity, Inc. • Vladimir Mirzoyan
This analysis answers one question: “If I deposit $1M into an UnblockEquity Morpho vault, what’s my expected annual loss rate, and worst-case loss in a 2008-style crash?”
Overview
UnblockEquity enables homeowners to borrow USDC against their home equity via Morpho Blue on Base. The collateral is a tokenized voluntary junior lien (eqBLOCK) backed by US residential real estate. Vault depositors earn yield from borrower interest payments.
The platform uses a 3-axis product architecture generating 24 product combinations:
Key finding: Of the 24 product combinations, 24 are viable (net yield >2%). The best combo (Standard) delivers 9.26% net yield. The 3-axis architecture lets curators select exactly the risk-return profile they want.
Three-Layer Protection Stack
No Fixed Payment Schedule on the UnblockEquity Loan
Interest accrues continuously at a variable rate (~4% APY). As long as the borrower’s LTV stays healthy — which happens naturally as the property appreciates — there are no required payments on any schedule. The borrower can repay any amount at any time. Most homeowners settle when they sell, refinance, or the loan matures.
This means Breathing Room reduces the homeowner’s monthly obligations rather than adding to them: the escrow covers the existing mortgage for 3-12 months, and the UnblockEquity loan itself adds zero monthly payment burden. This is the opposite of a HELOC, which adds payment pressure that often triggers the very default cascade it was supposed to prevent.
The House Pays for Its Own Rescue
During the 28-month FL foreclosure process, a $500K property appreciates by $53,776 at a conservative 4.5% annual rate. How many months of mortgage payments does that represent?
$53,776 ÷ $3,200/month = 16.8 months of mortgage payments.
A BR12 escrow covers 12 months at $3,200 = $38,400. The property’s natural appreciation during the foreclosure timeline that would have played out more than pays for the entire Breathing Room escrow. The homeowner’s house literally pays for its own rescue through appreciation alone — and they keep the remaining equity.
Position Sustainability
Borrowers choose their own borrow amount via a slider — they are never forced to max out. All equity is tokenized and posted as collateral from day one, but the borrow amount is the variable the homeowner controls.
The breakeven HPI formula: breakevenHPI = (borrowAmount × interestRate) / propertyValue
For a $1M home borrowing $200K at 4% interest, the breakeven is just 0.8% annual appreciation. Florida’s 10-year average HPI is 3–5%. At most realistic borrow amounts, the home’s natural appreciation covers the interest automatically — positions improve over time with no borrower action. This means no liquidation risk in normal markets.
Full 24-Combo Matrix
All 24 product combinations from the 3-axis architecture. Click any column header to sort. Use the filters below to narrow by axis.
| Combo | Verif. | BR | Recovery | LTV | PD | LGD | EL | Net Yield↓ | Viable |
|---|---|---|---|---|---|---|---|---|---|
| Standard | Standard | -- | Lien | 62.5% | 17.0% | 41.4% | 7.04% | 9.26% | |
| Standard + FC | Standard | -- | FC | 70.0% | 17.0% | 20.3% | 3.45% | 8.36% | |
| Standard + Breathing Room 6 | Standard | BR6 | Lien | 55.0% | 8.5% | 33.4% | 2.84% | 8.21% | |
| Standard + Breathing Room 12 | Standard | BR12 | Lien | 62.5% | 5.1% | 41.4% | 2.11% | 8.03% | |
| Standard + Breathing Room 3 | Standard | BR3 | Lien | 45.0% | 11.1% | 18.6% | 2.06% | 8.01% | |
| Prime | Prime | -- | Lien | 62.5% | 4.0% | 41.4% | 1.66% | 7.91% | |
| Prime + Breathing Room 3 | Prime | BR3 | Lien | 62.5% | 2.6% | 41.4% | 1.08% | 7.77% | |
| Verified | Verified | -- | Lien | 62.5% | 2.5% | 41.4% | 1.04% | 7.76% | |
| Standard + Breathing Room 12 + FC | Standard | BR12 | FC | 70.0% | 5.1% | 20.3% | 1.03% | 7.76% | |
| Standard + Breathing Room 6 + FC | Standard | BR6 | FC | 62.5% | 8.5% | 10.7% | 0.91% | 7.73% | |
| Prime + Breathing Room 6 | Prime | BR6 | Lien | 62.5% | 2.0% | 41.4% | 0.83% | 7.71% | |
| Prime + FC | Prime | -- | FC | 70.0% | 4.0% | 20.3% | 0.81% | 7.70% | |
| Verified + Breathing Room 3 | Verified | BR3 | Lien | 62.5% | 1.6% | 41.4% | 0.67% | 7.67% | |
| Verified + FC | Verified | -- | FC | 75.0% | 2.5% | 25.6% | 0.64% | 7.66% | |
| Prime + Breathing Room 3 + FC | Prime | BR3 | FC | 70.0% | 2.6% | 20.3% | 0.53% | 7.63% | |
| Verified + Breathing Room 6 | Verified | BR6 | Lien | 62.5% | 1.3% | 41.4% | 0.52% | 7.63% | |
| Prime + Breathing Room 12 | Prime | BR12 | Lien | 62.5% | 1.2% | 41.4% | 0.50% | 7.62% | |
| Verified + Breathing Room 3 + FC | Verified | BR3 | FC | 75.0% | 1.6% | 25.6% | 0.42% | 7.60% | |
| Prime + Breathing Room 6 + FC | Prime | BR6 | FC | 70.0% | 2.0% | 20.3% | 0.41% | 7.60% | |
| Verified + Breathing Room 6 + FC | Verified | BR6 | FC | 75.0% | 1.3% | 25.6% | 0.32% | 7.58% | |
| Verified + Breathing Room 12 | Verified | BR12 | Lien | 62.5% | 0.8% | 41.4% | 0.31% | 7.58% | |
| Prime + Breathing Room 12 + FC | Prime | BR12 | FC | 70.0% | 1.2% | 20.3% | 0.24% | 7.56% | |
| Verified + Breathing Room 12 + FC | Verified | BR12 | FC | 75.0% | 0.8% | 25.6% | 0.19% | 7.55% | |
| Standard + Breathing Room 3 + FC | Standard | BR3 | FC | 55.0% | 11.1% | 0.0% | 0.00% | 7.50% |
Showing 24 of 24 combos. All 24 combos yield 7.5-9.3% net. Higher risk = higher yield.
Expected Loss by Tier
Expected Loss = Probability of Default × Loss Given Default × Exposure at Default.
| Tier | LTV | Escrow | PD | LGD | EL (Annual) | EL per $1.00M |
|---|---|---|---|---|---|---|
| Verified | 62.5% | None | 2.5% | 41.4% | 1.04% | $10,350 |
| Prime | 62.5% | None | 4.0% | 41.4% | 1.66% | $16,560 |
| BR12 | 62.5% | 12 months | 5.1% | 41.4% | 2.11% | $21,114 |
| BR3 | 45.0% | 3 months | 11.1% | 18.6% | 2.06% | $20,565 |
| BR6 | 55.0% | 6 months | 8.5% | 33.4% | 2.84% | $28,398 |
| Standard | 62.5% | None | 17.0% | 41.4% | 7.04% | $70,380 |
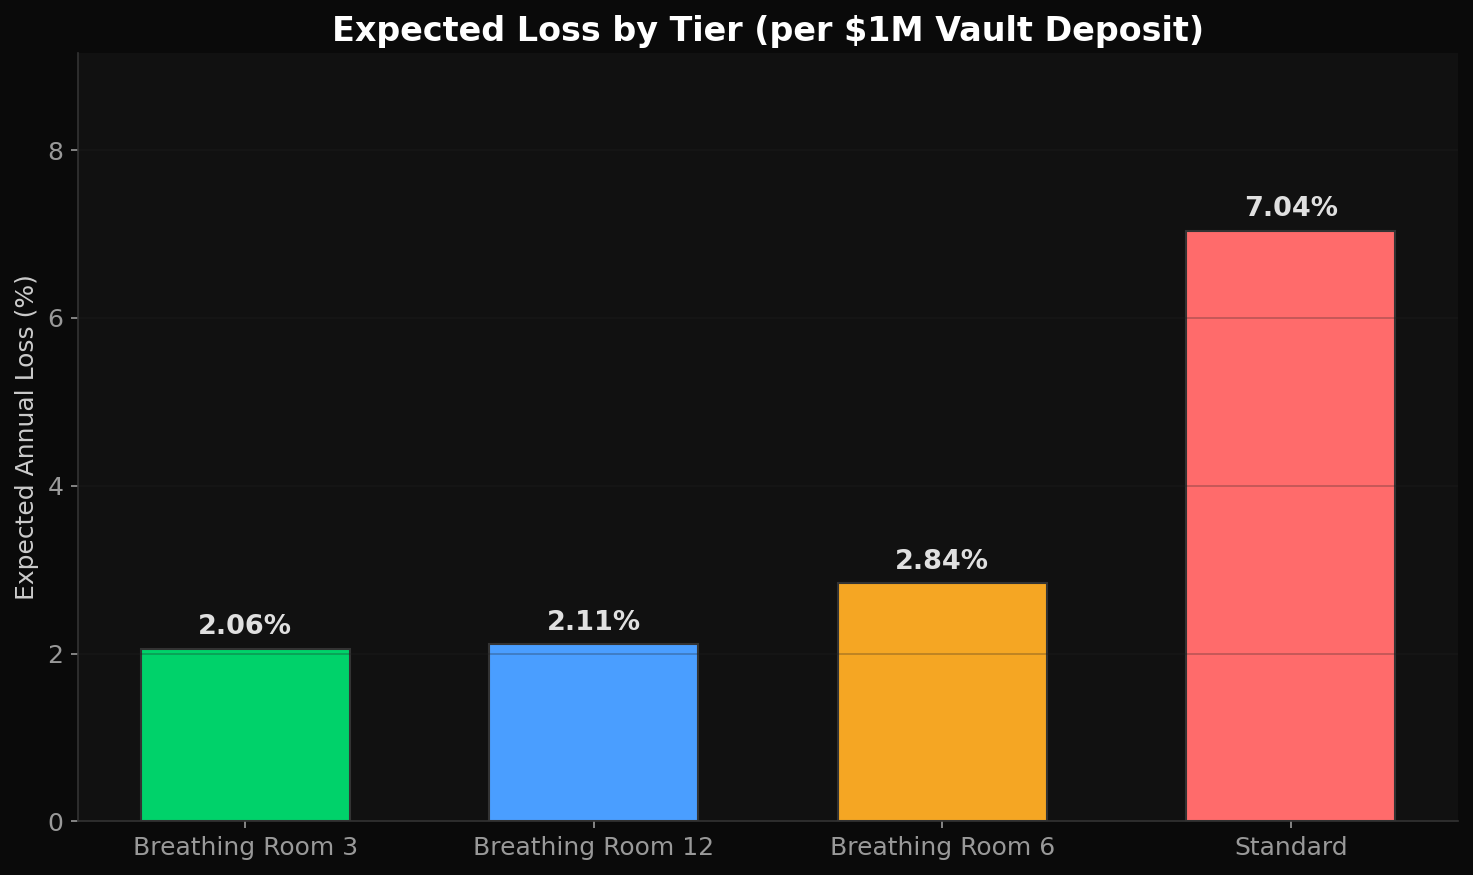
Figure 1: Expected loss breakdown by tier at baseline HPI decline
How PD Is Calculated
For Breathing Room tiers, the cure rate reflects the probability that a delinquent borrower returns to current status during the escrow period. Breathing Room’s auto-escrow guarantees mortgage performance during the escrow period, giving the borrower time to recover income and resume self-paying. Verified and Prime tiers use underwriting-based PD rates drawn from comparable prime and near-prime HELOC populations.
How LGD Is Calculated
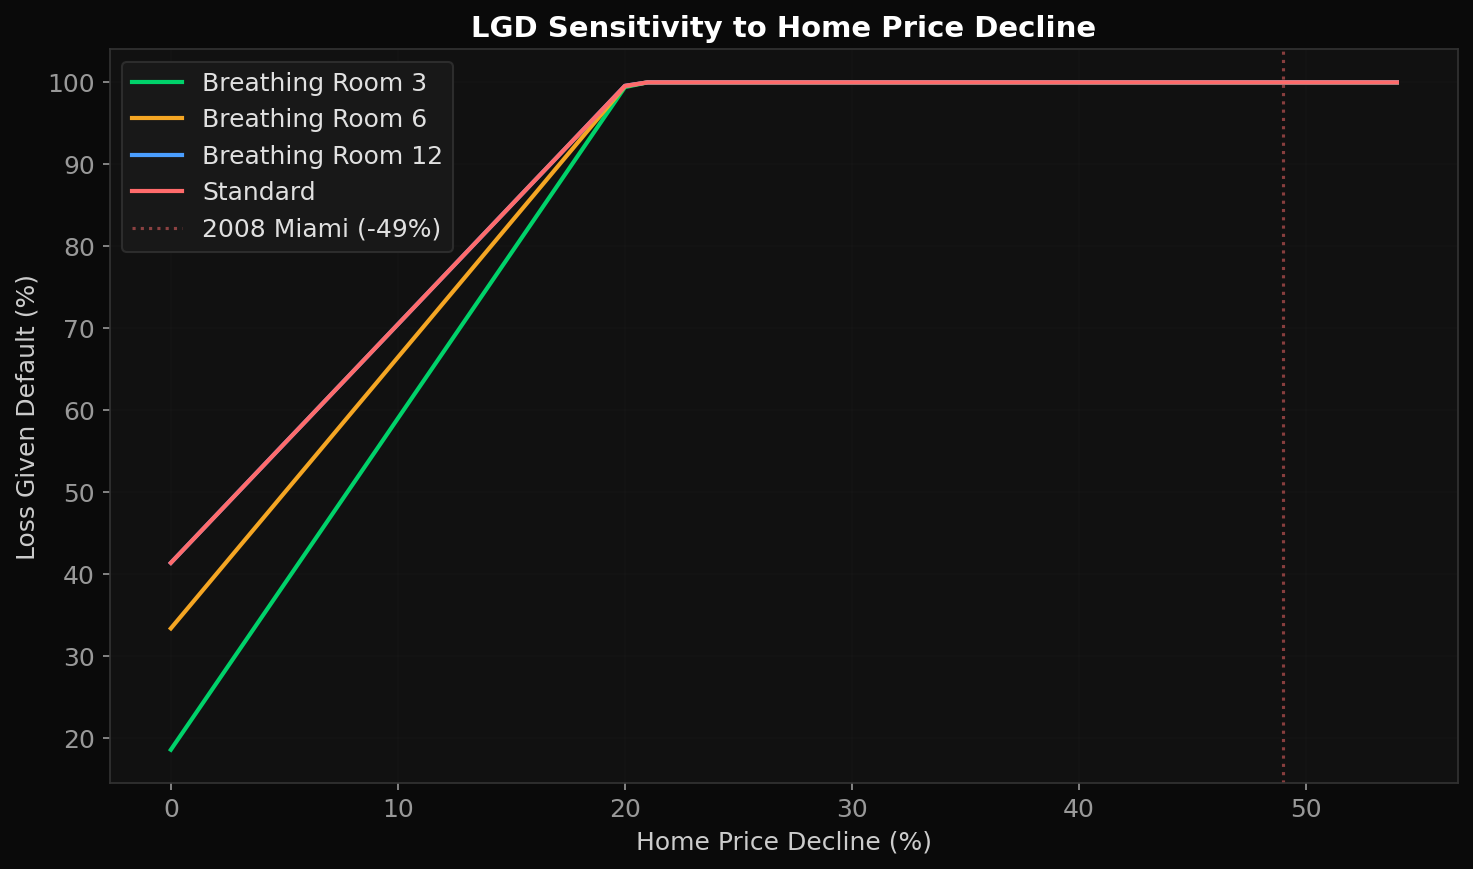
Figure 5: Loss Given Default sensitivity to HPI decline and REO discount
Stress Tests
| Scenario | HPI Decline | Verified EL | Prime EL | BR12 EL | BR6 EL | BR3 EL | Standard EL |
|---|---|---|---|---|---|---|---|
| Base Case | 0% | 1.04% | 1.66% | 2.11% | 2.84% | 2.06% | 7.04% |
| 2008 Replay | -49% | 2.50% | 4.00% | 5.10% | 8.50% | 11.05% | 17.00% |
| Rising Rates (+300bps) | -10% | 1.76% | 2.82% | 3.60% | 5.65% | 6.52% | 11.98% |
| 10% Abandonment | -15% | 2.34% | 3.74% | 4.77% | 7.76% | 9.63% | 15.90% |
| Combined Worst Case | -49% | 3.75% | 6.00% | 7.65% | 12.75% | 16.57% | 25.50% |
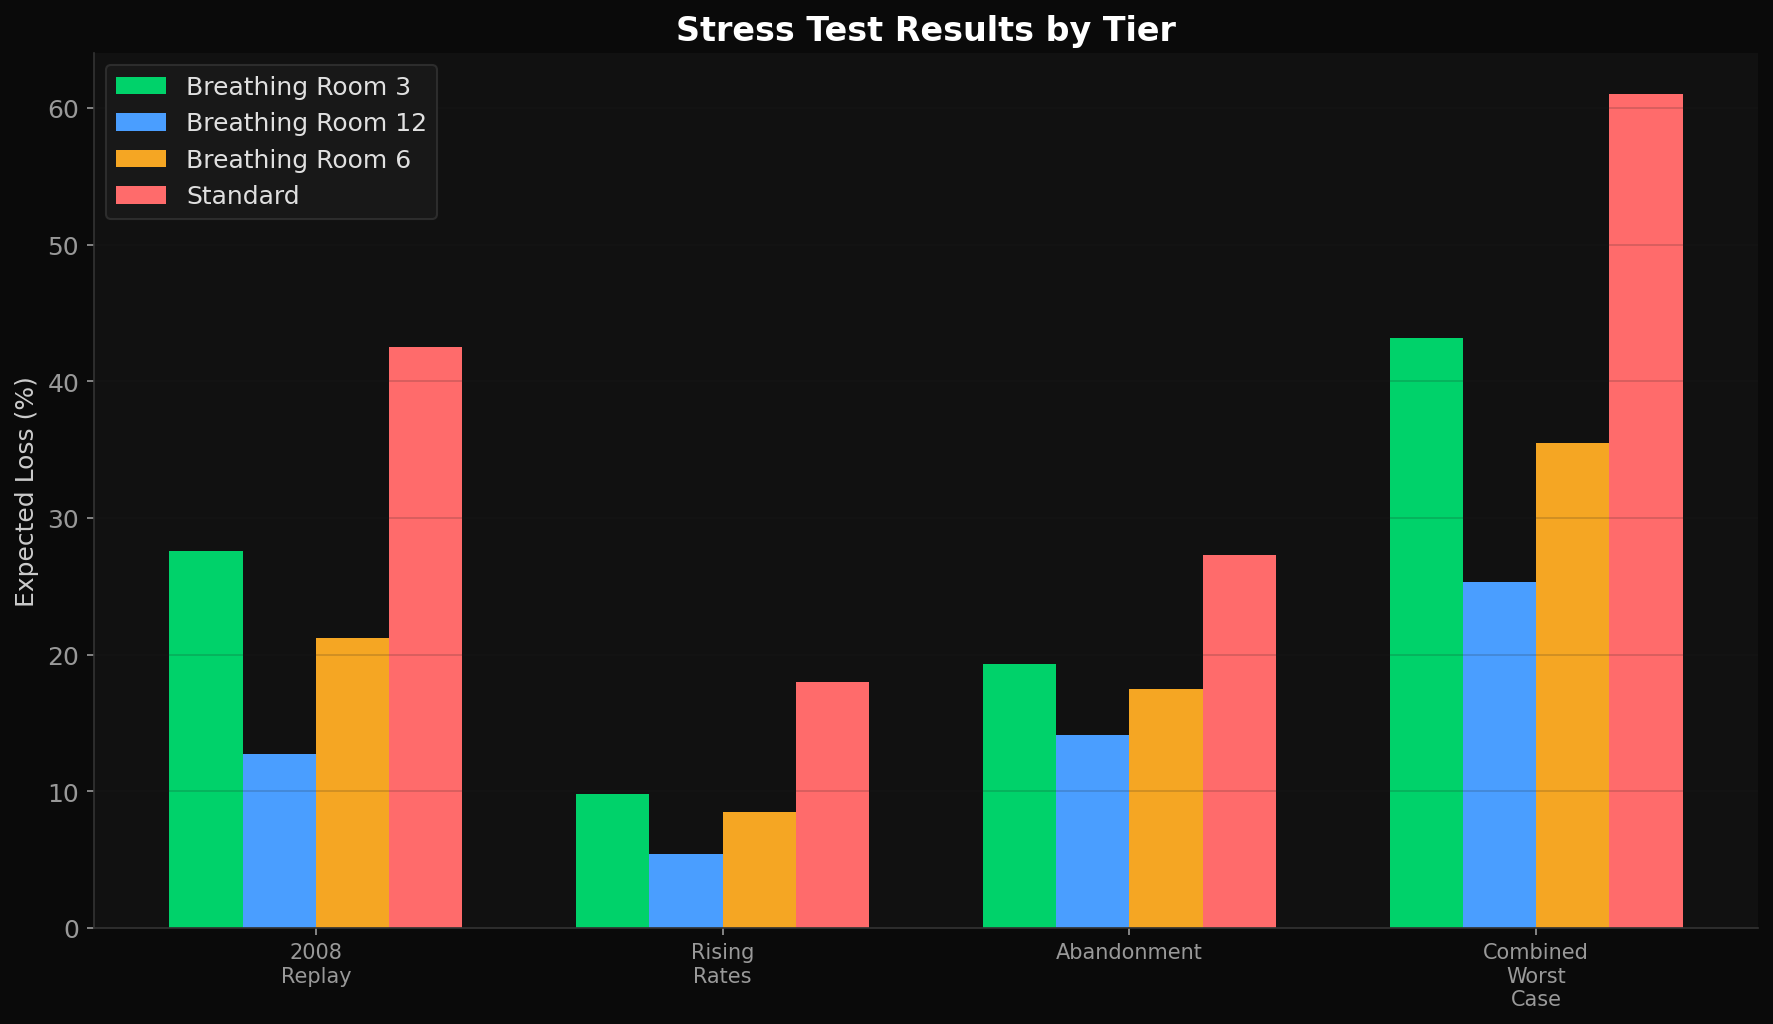
Figure 2: Stress test expected loss comparison across tiers and scenarios
2008 replay context: Miami home prices declined 49.3% peak-to-trough from June 2006 to October 2011 — the worst metro-level decline in modern US history. Even in this extreme scenario, BR12 expected loss is 5.10%, meaning depositors at 8% gross APR would see a net loss of ~8.77% annualized over a 5-year crisis. This is a severe but survivable drawdown.
Monte Carlo Simulation
10,000 GBM price paths calibrated from Case-Shiller Miami-Dade (1987-2025): μ = 5.25%, σ = 12.32% annualized.
| Tier | Mean Loss | VaR (95%) | CVaR (95%) |
|---|---|---|---|
| Verified | $10,350 | $27,500 | $36,300 |
| Prime | $16,560 | $44,000 | $58,100 |
| BR12 | $21,114 | $56,193 | $74,160 |
| BR3 | $20,565 | $109,356 | $155,722 |
| BR6 | $28,398 | $90,312 | $122,263 |
| Standard | $70,380 | $187,314 | $247,200 |
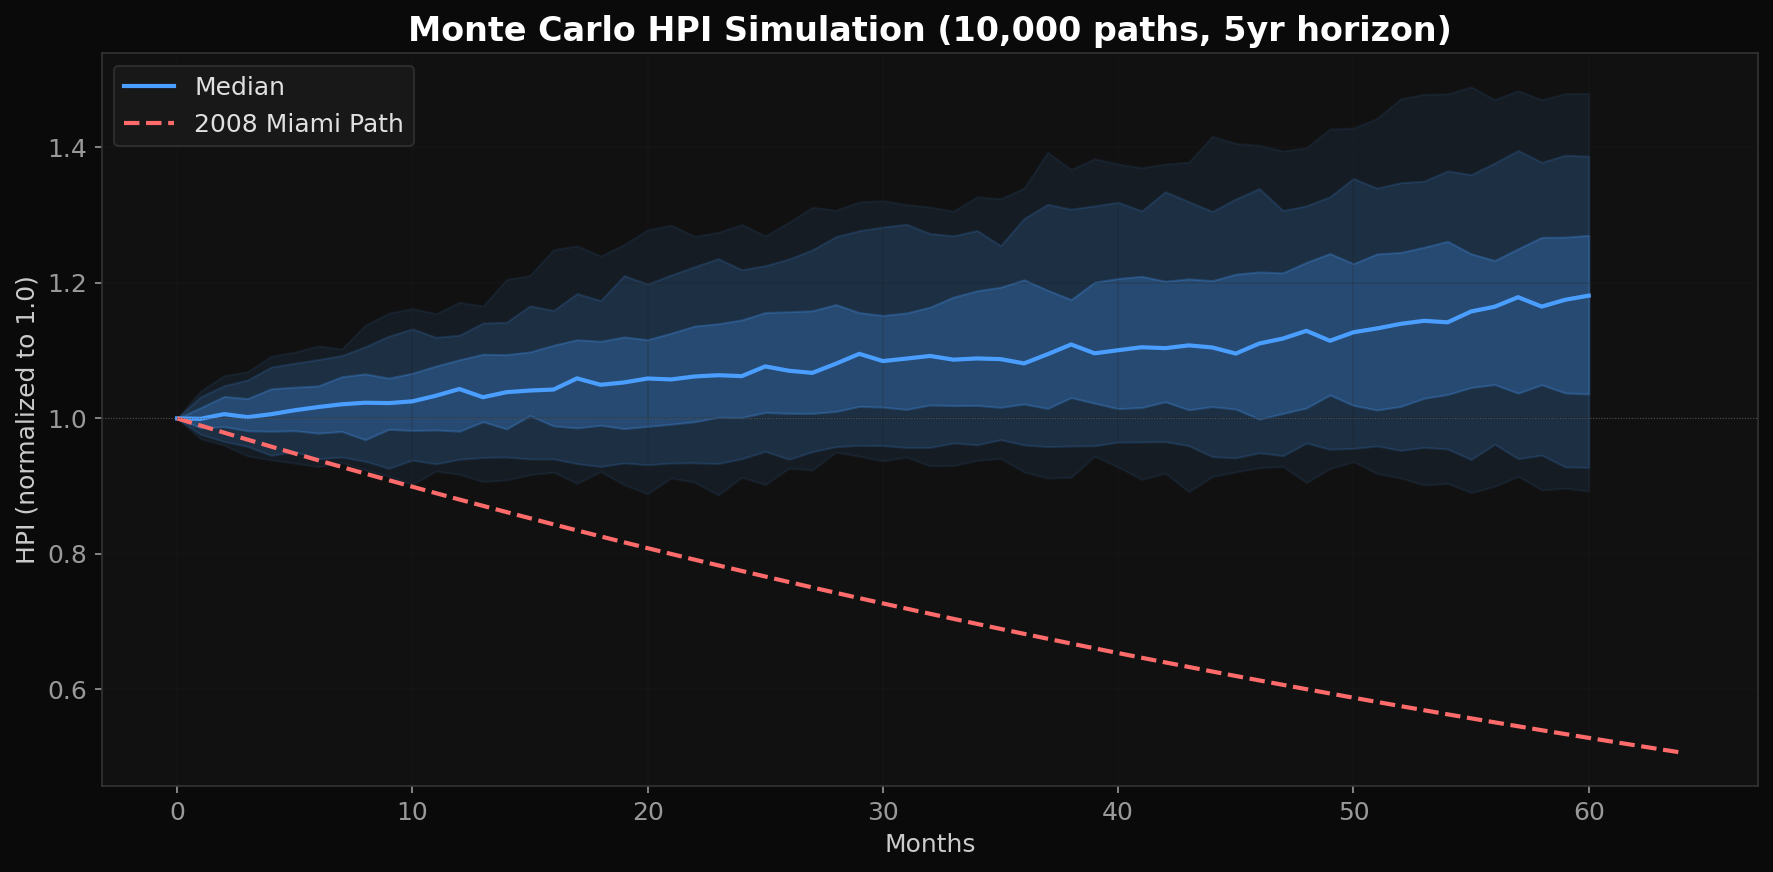
Figure 3: 10,000 GBM price paths with 2008 Miami actual path overlay
Markov Chain — State-Transition Default Model
Beyond Monte Carlo (price-path simulation), we model borrower behavior using a discrete-time Markov chain calibrated from MBA National Delinquency Survey data. Borrowers transition quarterly between delinquency states: Current → 30DPD → 60DPD → 90DPD+ → Default, with the possibility of curing at each stage.
Transition Matrix (Quarterly)
| From / To | Current | 30DPD | 60DPD | 90DPD+ | Default | Cured |
|---|---|---|---|---|---|---|
| Current | 97.5% | 1.5% | 0.0% | 0.0% | 0.0% | 1.0% |
| 30DPD | 0.0% | 20.0% | 17.0% | 0.0% | 0.0% | 63.0% |
| 60DPD | 0.0% | 0.0% | 15.0% | 65.0% | 0.0% | 20.0% |
| 90DPD+ | 0.0% | 0.0% | 0.0% | 30.0% | 55.0% | 15.0% |
| Default | 0.0% | 0.0% | 0.0% | 0.0% | 100.0% | 0.0% |
| Cured | 92.0% | 7.0% | 0.0% | 0.0% | 0.0% | 1.0% |
Cumulative Default Probability Over 5 Years
Starting from a distressed borrower (30 days past due), the Markov chain projects the probability of reaching absorbing “Default” state over 20 quarters. Breathing Room escrow keeps borrowers current, dramatically reducing state transitions.
Historical Simulation — What Actually Happened
Rather than making distributional assumptions (GBM, normal returns), historical simulation replays every actual 3-year window of Miami-Dade home prices from 1988–2024. This captures real-world fat tails, regime changes, and the exact 2006–2011 crash path — no model needed.
Miami-Dade HPI Annual Returns (1988–2024)
Rolling 3-Year Window Results
Bootstrap Resampling (5,000 paths)
We randomly resample (with replacement) from the 37 years of actual Miami returns to generate 5,000 synthetic 3-year paths. This captures fat tails and real-world correlations that parametric models (GBM) miss.
Depositor Returns
| Protocol / Tier | Base Rate | Expected Loss | Net Yield | Liquidity |
|---|---|---|---|---|
| UnblockEquity (Verified) | 7.5% | 1.04% | 7.76% | Instant* |
| UnblockEquity (Prime) | 7.5% | 1.66% | 7.91% | Instant* |
| UnblockEquity (BR12) | 7.5% | 2.11% | 8.03% | Instant* |
| UnblockEquity (BR3) | 7.5% | 2.06% | 8.01% | Instant* |
| UnblockEquity (BR6) | 7.5% | 2.84% | 8.21% | Instant* |
| Centrifuge (RWA) | 4.5% | N/A | 4.5% | Epoch-based (days/weeks) |
| Midas (T-Bills) | 5.2% | N/A | 5.2% | T+1 to T+2 |
| Ondo USDY | 5.3% | N/A | 5.3% | T+1 to T+2 |
| Maple (Corp Credit) | 8.5% | N/A | 8.5% | Fixed-term lockup |
| Goldfinch (EM) | 10.0% | N/A | 10.0% | Fixed-term lockup |
*Morpho vault withdrawals are instant, subject to vault utilization. No lockup period, no redemption queue.
Chart updates dynamically with the table above. UnblockEquity yields range from 7.50% (safest) to 9.26% (highest risk), all above Centrifuge, Midas, and Ondo.
Figure 4: Net yield comparison -- UnblockEquity vaults vs. DeFi competitors
Positioning: UnblockEquity vaults deliver 7.5-9.3% net yields across all combos, exceeding Ondo and Midas, backed by uncorrelated US residential real estate collateral — with a critical advantage: instant liquidity. Morpho vault depositors can withdraw at any time, with no lockup period. T-Bill products like Ondo USDY and Midas require T+1 to T+2 redemption windows. The 3-axis architecture gives curators 24 distinct risk-return profiles to choose from.
Foreclosure Backtest: Real Data
We backtested the Breathing Room concept against 506K real loan denials from the CFPB HMDA database (2022) across FL, CA, TX, NY, and IL, combined with NY Fed quarterly foreclosure data and MBA cure rates.
42.7% of ALL foreclosures were preventable by Breathing Room
57% of foreclosures where the homeowner had equity were preventable
DeFi is the answer to unnecessary foreclosures. Banks denied these homeowners HELOCs. Morpho vaults on Base could have saved them.
HMDA Denial Analysis by State (2022)
| State | Total Denials | Credit History Denied | BR-Eligible (>30% equity) | Median Home Value | Subordinate Lien % |
|---|---|---|---|---|---|
| FL | 113,441 | 22,332 (19.7%) | 41,250 (43.8%) | $375,000 | 29.4% |
| CA | 113,210 | 15,031 (13.3%) | 55,992 (53.5%) | $705,000 | 34.7% |
| TX | 113,915 | 30,553 (26.8%) | 34,141 (39.7%) | $305,000 | 21.0% |
| NY | 92,635 | 20,837 (22.5%) | 38,558 (45.8%) | $495,000 | 38.4% |
| IL | 72,707 | 20,731 (28.5%) | 20,807 (32.6%) | $255,000 | 30.2% |
Foreclosure Prevention Estimate
| Metric | 5 States (2022) | National (extrapolated) |
|---|---|---|
| Annual foreclosures | 44,878 | ~90,000 |
| With sufficient equity for BR | 33,658 | ~67,000 |
| Preventable with Breathing Room | 19,180 | ~38,000 |
| Loss prevented | $1.53B | ~$3.07B |
The HELOC pressure finding: 29-38% of loan denials across all states involved subordinate liens (HELOCs, second mortgages). NY Fed data shows HELOC delinquency spiked 7.2x during 2007-2011. HELOCs add payment pressure; Breathing Room removes it. The escrow covers existing mortgage payments, creating a payment-free window for income recovery.
DeFi vs. TradFi: Traditional finance created this problem — banks denied HELOCs to homeowners with real equity, and nearly half ended up in foreclosure anyway. DeFi solves it: Morpho vault depositors on Base earn 7.5-9.3% net yield while funding escrows that prevent unnecessary foreclosures. 42.7% of all foreclosures and 57% of equity foreclosures were preventable. This isn’t theoretical — it’s backed by 506K real CFPB HMDA records across 5 states.
Data integrity: All denial figures are from the CFPB’s public HMDA database (ffiec.cfpb.gov) — federally mandated, loan-level reporting. Foreclosure rates from the NY Fed Consumer Credit Panel (Equifax-sourced). These are not estimates or surveys — they are census-level regulatory data.
Foreclosure Economics: The Cost of Inaction
Our backtest showed 42.7% of foreclosures were preventable. This section quantifies what each preventable foreclosure actually destroys — and what Breathing Room costs to prevent it.
The average FL foreclosure destroys $262,000 in homeowner wealth.
Breathing Room prevents it for under $28,000.
Based on a $500K FL property with 26% equity, 28-month judicial foreclosure timeline, and conservative 4.5% appreciation.
The Foreclosure Waterfall
Every dollar is claimed before the homeowner sees anything. On a $500K property, the math is brutal:
| Line Item | Amount |
|---|---|
| Gross sale proceeds (after 25% REO discount) | $415,332 |
| Less: Outstanding mortgage balance | -$370,000 |
| Less: Accrued interest (5.25% default rate, 2.33yr) | -$34,225 |
| Less: Missed payments (28 months x $3,200) | -$89,600 |
| Less: Late fees & penalties | -$6,720 |
| Less: Lender attorney fees & court costs | -$10,000 |
| Less: Title, preservation, taxes, insurance, HOA | -$41,500 |
| Less: Disposition costs (agent, closing, repairs) | -$44,073 |
| Net to Homeowner | -$180,786 |
The homeowner receives NOTHING. The $180K deficiency means costs exceeded proceeds. In Florida, lenders can pursue a deficiency judgment within one year (FL Statute 702.06). The homeowner loses their $130K in equity, $54K in appreciation, and their housing stability — all destroyed.
Appreciation Lost During the Process
4.5% annual appreciation over the 28-month FL judicial foreclosure process. At the 3-year trailing average of 9.6%, this number jumps to $119,466.
Foreclosure Path vs. Breathing Room Path
| Metric | Foreclosure Path | Breathing Room Path |
|---|---|---|
| Duration of distress | 28 months | 12 months (BR12) |
| Homeowner keeps home | No | Yes |
| Equity preserved | $0 | $130,000 |
| Appreciation captured | $0 | $53,776 |
| Credit score impact | -100 to -160 pts (7 years) | None |
| Cost to homeowner | $262,176 destroyed | $27,149 in fees/interest |
| Cost to lender | $220,000 loss severity | $0 (loan becomes current) |
| Cost to community | $90,000+ neighbor value loss | $0 |
| Net position after 2 years | Homeless, damaged credit, zero equity | Home retained, $184K equity, clean credit |
Costs to All Parties
A single foreclosure sends a shockwave through the entire economic ecosystem:
Equity + appreciation + housing stability + credit damage costs
Loss on sale + REO costs + 9x servicing cost premium on NPLs
~1% property value reduction within 660 ft (Cleveland Fed)
Lost tax revenue + court system costs + social services
Total economic destruction per foreclosure
$592,176
Breathing Room cost to prevent it: $27,149 — homeowner ROI: 10.5x. Economy-wide: 21.8x.
Sources: ATTOM Data Solutions (REO discounts, foreclosure timelines), Urban Institute (loss severity), Cleveland Fed (neighborhood impact), MBA (servicing costs), CFPB HMDA (denial data), FRED Case-Shiller Miami MSA (appreciation), FL Statutes Ch. 702 (judicial process). Full methodology in the section.
Methodology & Data Sources
Data Sources
| Dataset | Source | Usage |
|---|---|---|
| Case-Shiller Miami MSA | FRED (series MIXRNSA) | GBM calibration, Monte Carlo, Historical Sim, Bootstrap |
| MBA National Delinquency Survey | Mortgage Bankers Association | PD base rate, cure rates, Markov transition calibration |
| FDIC Loss-Share Data | FDIC public records | LGD calibration (2nd lien severity) |
| FL Foreclosure Process | FL Statutes Ch. 702 | Foreclosure timeline, carrying costs |
Key Assumptions
| Parameter | Value | Source |
|---|---|---|
| Base PD (underbanked) | 17% | MBA NDS, FL-adjusted |
| 12-month cure rate | 70% | MBA NDS (national) |
| REO liquidation discount (Lien-only) | 20% | FDIC Loss-Share |
| REO liquidation discount (Foreclosure) | 15% | Active recovery advantage |
| Lien-only recovery timeline | 720 days | FL judicial process |
| Foreclosure recovery timeline | 360 days | UE-initiated, faster resolution |
| Annual carrying costs | 4% | Taxes, insurance, maintenance, legal |
| Foreclosure cost (active) | 0.5% of property | Filing, auction, legal fees |
| GBM drift (mu) | 5.25% | Case-Shiller Miami 1987-2025 |
| GBM volatility (sigma) | 12.32% | Case-Shiller Miami 1987-2025 |
| Reference property value | $500,000 | FL median (model default) |
| Senior LTV (current) | 56% | Typical paid-down balance |
Conservative Biases
This model is intentionally conservative throughout:
- PD uses national cure rates (FL-specific rates are slightly lower, making our PD higher)
- LGD assumes full REO discount even though lien recovery may be negotiated pre-foreclosure
- No credit given for callable overcollateralization (Layer 2 protection)
- No value assigned to Florida homestead protections that reduce strategic default incentive
- Carrying costs assumed at 4% annual even though actual costs are often lower
- 2008 stress test uses the literal worst metro-level decline in modern US history
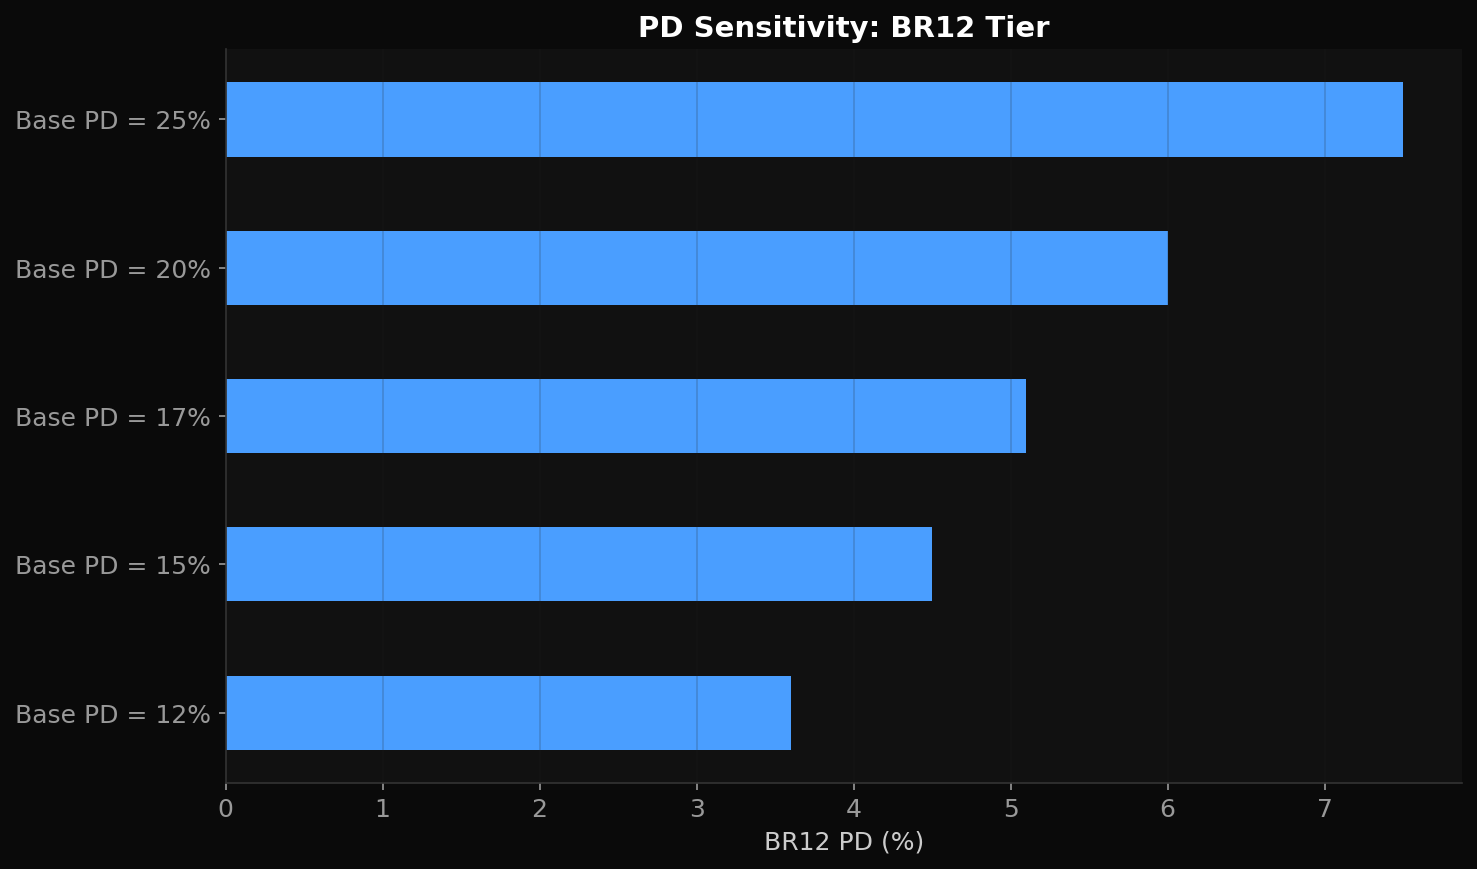
Figure 6: Probability of Default sensitivity to base PD and cure rate assumptions
Limitations
Important: This is a v2 model built from public data and published literature. It has not been independently validated by a third-party actuarial firm. Key limitations include:
- Small sample size: UnblockEquity has originated one deal. Historical loss data does not exist for this specific product.
- GBM may not capture tail risk or regime changes -- mitigated by Historical Simulation and Bootstrap Resampling cross-validation.
- Cure rates are from national MBA data; FL-specific rates may differ.
- The model assumes diversified portfolio; single-property concentration risk is higher.
We welcome peer review and feedback. The model code will be open-sourced after initial curator review.
PD/LGD models, Monte Carlo simulation, stress tests, vault return projections, and complete methodology with appendices.
Read the full narrative: The Math Behind Breathing Room
UnblockEquity, Inc. • unblockequity.com • Built on Base • Powered by Morpho
Model code: Request access • Read the full whitepaper